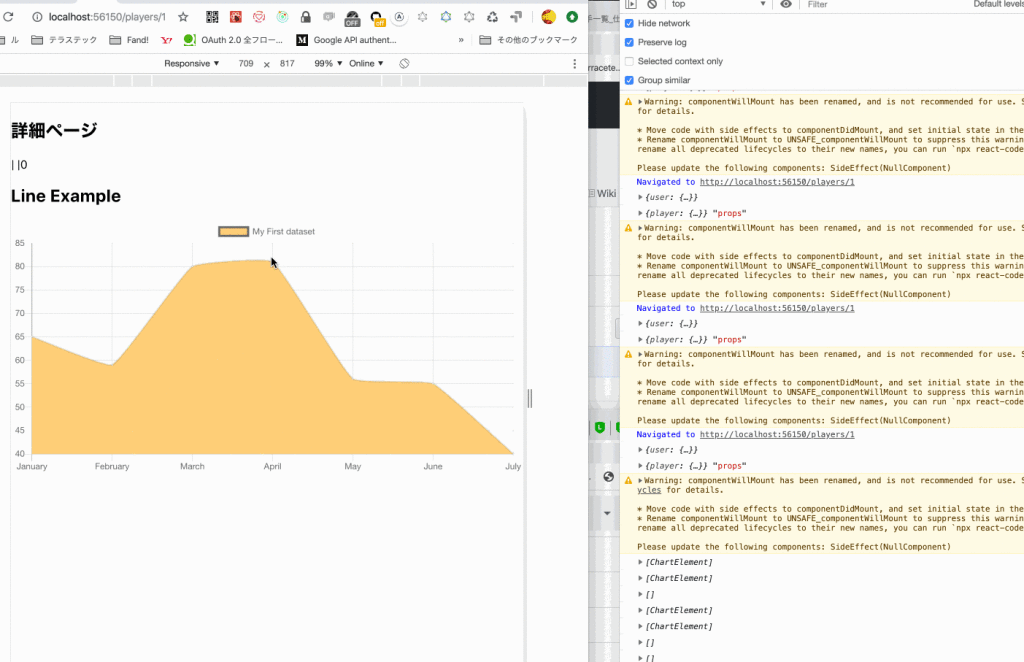
【React-ChartJS2-TypeScript】Reactでグラフを作る際に色を塗りにして、クリックイベントを取得する(When creating a graph with React-chartjs2, paint the color and get the click event)

Reactでグラフを作る機会がありどれがいいんだろうと思って探していた
https://github.com/jerairrest/react-chartjs-2
これっぽいけど、イシューの数とメンテナンサーガ足りてないとか言っているので
ちょっと不安ではあります。。(イシューででReact17対応が叫ばれている...)
ただ、デザインと要件があっているのでこれを使うことに。

公式のSampleは、colorを塗りつぶすこととclickイベントをつけられてなかったので、
ちょっと読んだ。
なーんだあるじゃんと思ったので
サンプル作っておく
It is written that the number of issues and maintenance saga are not enough
A little anxious (React17 not supported in the issue ...)
However, I decided to use this because of the design and requirements.
The official Sample wasn't colored with a click event,
I read a little.
Made sample
yarn add -D react-chartjs-2
したあと
yarn add -D @types/react-chartjs-2
して
datasetのfillをtrue
onElementsClickを渡せばちょうどグラフのポイントをクリックしたらイベントが取れます

